
Darkstat is a lightweight network traffic analyzer that captures packets and presents real-time statistics through a built-in web dashboard. Whether you need to monitor home network bandwidth, troubleshoot which devices are consuming data, or track server connections on a headless system, Darkstat provides clear visualizations of traffic flows. As a result, you can identify bandwidth issues without the overhead of enterprise monitoring solutions.
Specifically, this guide walks you through installing and configuring Darkstat on Ubuntu using the default repositories. By the end, you will have a working web-based traffic monitor accessible from any browser on your network.
Install Darkstat via APT Command
To begin, refresh your package index and then install Darkstat using the APT package manager. The package is available in Ubuntu’s universe repository, which is enabled by default on most installations:
sudo apt update
sudo apt install darkstat
Once complete, confirm the installed version:
darkstat --versiondarkstat 3.0.719 (using libpcap version 1.10.4 (with TPACKET_V3))
Verify Darkstat Service Status
After confirming the version, check whether the Darkstat service is recognized by systemd:
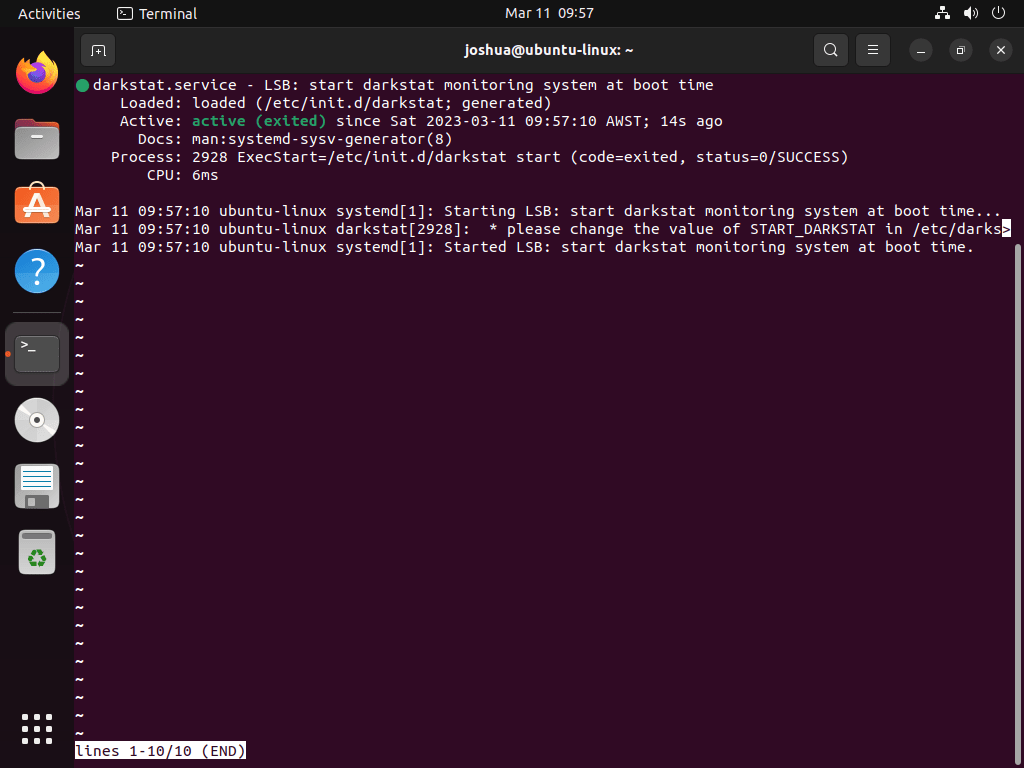
systemctl status darkstatAfter a fresh install, the service will likely show as inactive because Darkstat requires configuration before it can start. Consequently, this is expected behavior—continue to the configuration section below to enable and configure the service.
Configure Darkstat
Identify the Network Interface
Before configuring Darkstat, you need to select the network interface it will observe. This interface could be an Ethernet connection, a Wi-Fi link, or a virtual network interface established by VPN services.
Therefore, discover the available network interface names by running the following command:
ip link1: lo: <LOOPBACK,UP,LOWER_UP> mtu 65536 qdisc noqueue state UNKNOWN
link/loopback 00:00:00:00:00:00 brd 00:00:00:00:00:00
2: enp0s3: <BROADCAST,MULTICAST,UP,LOWER_UP> mtu 1500 qdisc fq_codel state UP
link/ether 08:00:27:xx:xx:xx brd ff:ff:ff:ff:ff:ff
In this example, enp0s3 is the primary network interface (common on VirtualBox VMs). However, your interface name will vary based on your hardware—look for entries other than lo (loopback). Common names include eth0 (older systems), ens33 (VMware), or wlp2s0 (Wi-Fi).
Edit Darkstat Configuration
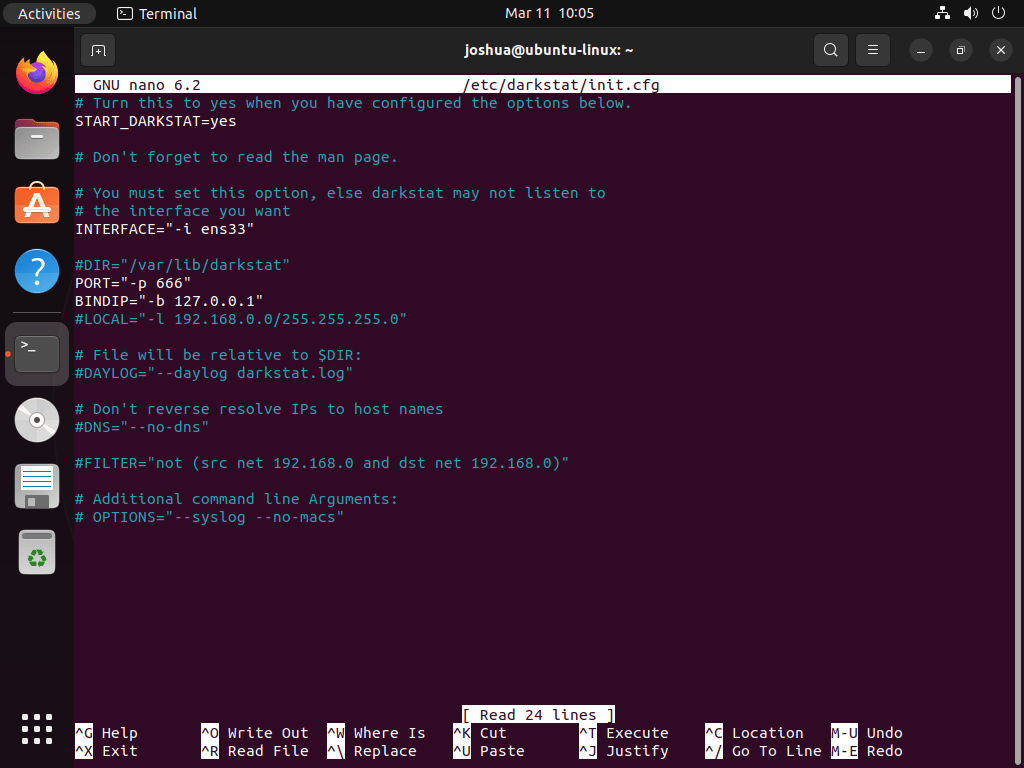
Now, access Darkstat’s configuration file to customize its settings:
sudo nano /etc/darkstat/init.cfgWithin the configuration file, locate and modify the startup setting. Find this line:
START_DARKSTAT=noThen, change this value to enable automatic startup:
START_DARKSTAT=yesNext, update the network interface line. Change the default:
INTERFACE="-i eth0"Accordingly, change this to match your actual interface name (from ip link output):
INTERFACE="-i enp0s3"Note that the default interface value -i eth0 uses legacy naming. On modern Ubuntu systems, however, interfaces typically use predictable names like enp0s3 (VirtualBox), ens33 (VMware), or wlp2s0 (Wi-Fi). As a result, you should replace the interface name with the one identified by ip link earlier. Additionally, you can change the PORT setting—the default is port 667. Finally, after making your adjustments, save and exit by pressing CTRL+X, then Y to confirm.
Restart Darkstat Service
After saving the configuration, restart the Darkstat service to apply your changes:
sudo systemctl restart darkstatNext, verify that the service started successfully:
systemctl status darkstatAs a result, the output should show Darkstat as active and running:
● darkstat.service - LSB: start darkstat monitoring system at boot time
     Loaded: loaded (/etc/init.d/darkstat; generated)
     Active: active (running)
However, if the service fails to start, double-check that your interface name matches the output from ip link and that START_DARKSTAT is set to yes.
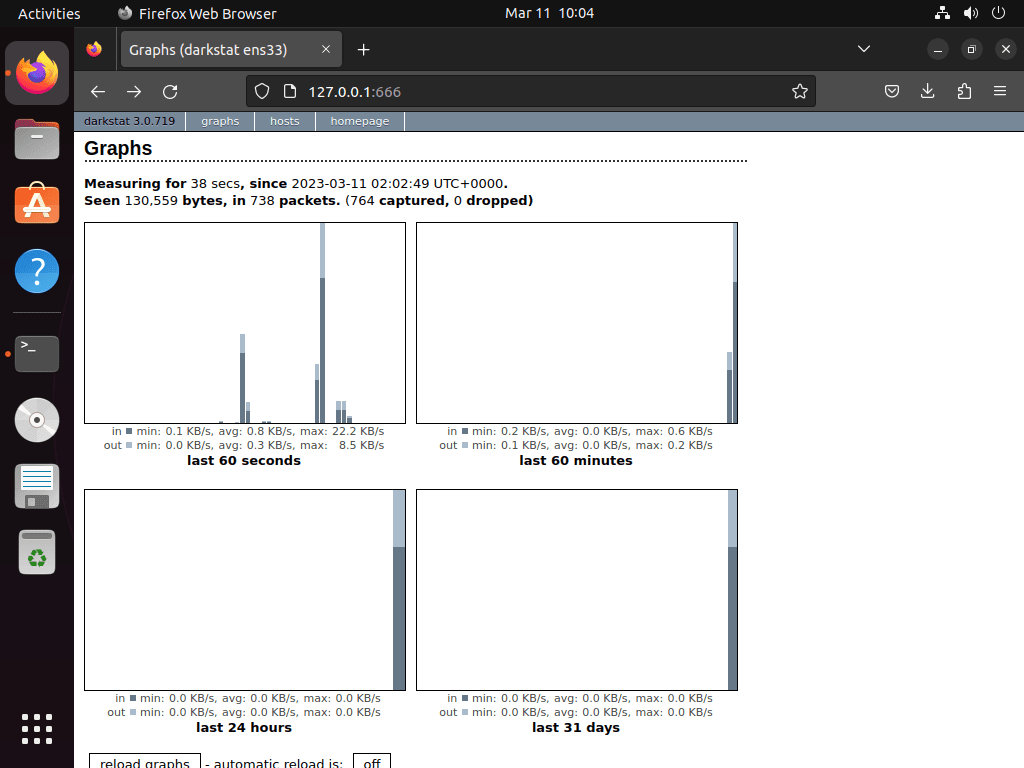
Accessing the Darkstat Dashboard
With Darkstat running, access its web dashboard by opening a browser and navigating to your server’s IP address on port 667 (the default). For example, if your system’s IP is 192.168.1.100:
http://192.168.1.100:667Once loaded, the dashboard displays traffic graphs, bandwidth usage by host, and protocol breakdowns. If you configured a custom port in the configuration file, use that port number instead.
Additionally, if you have UFW firewall enabled on Ubuntu, allow access to the Darkstat port with
sudo ufw allow 667/tcpbefore attempting to connect from another machine on your network.
Remove Darkstat from Ubuntu
Alternatively, if you no longer need Darkstat, remove it along with any unused dependencies:
sudo apt remove darkstat
sudo apt autoremove
Afterwards, verify the removal completed successfully:
which darkstat || echo "darkstat removed"darkstat removed
Note that the configuration file at /etc/darkstat/init.cfg may remain after removal. Therefore, to completely purge Darkstat including configuration files, use sudo apt purge darkstat instead of apt remove.
Conclusion
You now have Darkstat monitoring traffic on your selected network interface, with a web dashboard accessible at port 667. Additionally, for complementary monitoring, consider installing Bmon on Ubuntu for real-time terminal-based bandwidth visualization, or htop for system process monitoring. Finally, keep Darkstat updated through your regular system updates with sudo apt upgrade.